
Gnuplot/palette
調色盤或顏色漸變[1]
調色盤是用於
- `pm3d`
- 填充顏色輪廓或多邊形
- 彩色直方圖
- 彩色漸變背景
- 以及任何它現在或將來實現的東西的…
在這裡,它代表一個平滑的“連續”顏色或灰度調色盤,但讓我們稱之為調色盤。顏色調色盤需要終端條目來填充彩色多邊形和平滑顏色的調色盤,當前可用於在`set pm3d`的幫助中列出的終端。
顏色值的範圍可以透過
- `set cbrange`
- `set log cb`獨立調整。
整個調色盤在`colorbox`中視覺化。
語法
 show palette
 show palette palette <n> {{float | int}}
 show palette gradient
 show palette fit2rgbformulae
 show palette rgbformulae
命令
- `show palette` 顯示當前調色盤屬性。
- `show palette gradient` 顯示定義調色盤的漸變(如果適用)。
- `show palette rgbformulae` 列印可用的固定灰度 -> 顏色轉換公式。
- `show palette palette <n>` 將當前調色盤設定和具有 <n> 個離散顏色的調色盤計算的 RGB 三元組表列印到螢幕或`set print`指定的檔案。預設寬表可以透過選項 float 或 int 分別限制為 r、g、b 浮點值 [0..1] 或整數值 [0..255] 的 3 列。這樣,當前 gnuplot 顏色調色盤可以載入到其他影像應用程式中,例如 Octave。或者,`test palette` 命令將繪製當前調色盤的 R、G、B 剖面,並將剖面值保留在資料塊 $PALETTE 中。
檢查標準顏色漸變(傳統的 pm3d 是黑色-藍色-紅色-黃色)
show palette
輸出
palette is COLOR
rgb color mapping by rgbformulae are 7,5,15
figure is POSITIVE
all color formulae ARE NOT written into output postscript file
allocating ALL remaining color positions for discrete palette terminals
Color-Model: RGB
gamma is 1.5
幫助
help show palette
命令 `test palette` 繪製 R(z)、G(z)、B(z) 的輪廓,其中 0<=z<=1。這些是當前顏色`palette` 的 RGB 分量。它還繪製使用 NTSC 係數將 RGB 對映到灰度而計算的表觀淨強度。輪廓值也載入到名為 $PALETTE 的資料塊中。
test palette[2]

它可以儲存到圖形檔案
set terminal png
set output 'p.png'
test palette
其中
- NTSC

//from function test_palette_subcommand from command.c
ntsc = 0.299 * rgb.r + 0.587 * rgb.g + 0.114 * rgb.b;
程式碼
// command.c
/*
 * process the 'test palette' command
 * 1) Write a sequence of plot commands + set commands into a temp file
 * 2) Create a datablock with palette values
 * 3) Load the temp file to plot from the datablock
 *    The set commands then act to restore the initial state
 */
static void
test_palette_subcommand()
{
    enum {test_palette_colors = 256};
    struct udvt_entry *datablock;
    char *save_replot_line;
    TBOOLEAN save_is_3d_plot;
    int i;

    static const char pre1[] = "\
reset;\
uns border; se tics scale 0;\
se cbtic 0,0.1,1 mirr format '' scale 1;\
se xr[0:1];se yr[0:1];se zr[0:1];se cbr[0:1];\
set colorbox hor user orig 0.05,0.02 size 0.925,0.12;";

    static const char pre2[] = "\
se lmarg scre 0.05;se rmarg scre 0.975; se bmarg scre 0.22; se tmarg scre 0.86;\
se grid; se xtics 0,0.1;se ytics 0,0.1;\
se key top right at scre 0.975,0.975 horizontal \
title 'R,G,B profiles of the current color palette';";

    static const char pre3[] = "\
p NaN lc palette notit,\
$PALETTE u 1:2 t 'red' w l lt 1 lc rgb 'red',\
'' u 1:3 t 'green' w l lt 1 lc rgb 'green',\
'' u 1:4 t 'blue' w l lt 1 lc rgb 'blue',\
'' u 1:5 t 'NTSC' w l lt 1 lc rgb 'black'\
\n";

    FILE *f = tmpfile();

#if defined(_MSC_VER) || defined(__MINGW32__)
    /* On Vista/Windows 7 tmpfile() fails. */
    if (!f) {
	char buf[PATH_MAX];
	/* We really want the "ANSI" version */
	GetTempPathA(sizeof(buf), buf);
	strcat(buf, "gnuplot-pal.tmp");
	f = fopen(buf, "w+");
    }
#endif

    while (!END_OF_COMMAND)
	c_token++;
    if (!f)
	int_error(NO_CARET, "cannot write temporary file");

    /* Store R/G/B/Int curves in a datablock */
    datablock = add_udv_by_name("$PALETTE");
    if (datablock->udv_value.type != NOTDEFINED)
	gpfree_datablock(&datablock->udv_value);
    datablock->udv_value.type = DATABLOCK;
    datablock->udv_value.v.data_array = NULL;

    /* Part of the purpose for writing these values into a datablock */
    /* is so that the user can read them back if desired.  But data  */
    /* will be read back using the current numeric locale, so for    */
    /* consistency we must also use the locale when creating it.     */
    set_numeric_locale();
    for (i = 0; i < test_palette_colors; i++) {
	char dataline[64];
	rgb_color rgb;
	double ntsc;
	double z = (double)i / (test_palette_colors - 1);
	double gray = (sm_palette.positive == SMPAL_NEGATIVE) ? 1. - z : z;
	rgb1_from_gray(gray, &rgb);
	ntsc = 0.299 * rgb.r + 0.587 * rgb.g + 0.114 * rgb.b;
	sprintf(dataline, "%0.4f %0.4f %0.4f %0.4f %0.4f %c",
		z, rgb.r, rgb.g, rgb.b, ntsc, '\0');
	append_to_datablock(&datablock->udv_value, strdup(dataline));
    }
    reset_numeric_locale();

    /* commands to setup the test palette plot */
    enable_reset_palette = 0;
    save_replot_line = gp_strdup(replot_line);
    save_is_3d_plot = is_3d_plot;
    fputs(pre1, f);
    fputs(pre2, f);
    fputs(pre3, f);

    /* save current gnuplot 'set' status because of the tricky sets
     * for our temporary testing plot.
     */
    save_set(f);

    /* execute all commands from the temporary file */
    rewind(f);
    load_file(f, NULL, 1); /* note: it does fclose(f) */

    /* enable reset_palette() and restore replot line */
    enable_reset_palette = 1;
    free(replot_line);
    replot_line = save_replot_line;
    is_3d_plot = save_is_3d_plot;
}
命令 `set palette` 不帶選項
set palette
設定預設值
程式碼
// color.c
void
init_color()
{
  /* initialize global palette */
  sm_palette.colorFormulae = 37;  /* const */
  sm_palette.formulaR = 7;
  sm_palette.formulaG = 5;
  sm_palette.formulaB = 15;
  sm_palette.positive = SMPAL_POSITIVE;
  sm_palette.use_maxcolors = 0;
  sm_palette.colors = 0;
  sm_palette.color = NULL;
  sm_palette.ps_allcF = FALSE;
  sm_palette.gradient_num = 0;
  sm_palette.gradient = NULL;
  sm_palette.cmodel = C_MODEL_RGB;
  sm_palette.Afunc.at = sm_palette.Bfunc.at = sm_palette.Cfunc.at = NULL;
  sm_palette.colorMode = SMPAL_COLOR_MODE_RGB;
  sm_palette.gamma = 1.5;
}
語法
set palette file '<filename>' {datafile-modifiers}
哪裡
- filename 是包含資料列的調色盤檔案的檔名。它不是副檔名為 pal 的包含 gnuplot 命令的檔案
- data-modifiers 是可選的組成部分,用於從調色盤(表格)中選擇元素。例如:'using ($1/255):($2/255):($3/255)'
命令 `set palette file` 等效於命令 set palette defined,資料從 filename 檔案中讀取。
我們檢查幫助內容
help set palette file
用例
- 文字檔案(gpf 不是 pal,我們使用 load 命令載入)
- 二進位制檔案
- 從命令列讀取的資料
語法
set palette file 'palette.txt' using ($1/255):($2/255):($3/255) # Read in a palette of RGB triples each in range [0,255]
檔案中可以有
- 4 列:gray、R、G、B
- 三列:R、G、B
# http://soliton.vm.bytemark.co.uk/pub/cpt-city/arendal/arctic.gpf
set palette file "arctic.gpf"
set terminal png
set output "arctic.png"
test palette
文字檔案 gpf 集
- cpt-city : "Gnuplot Palette File (with gpf extension) in the RGB colour-space"(4 列)
- Fractint 程式的地圖檔案(3 列)
set palette file "Skydye07.map" using ($1/255):($2/255):($3/255) # Read in a palette of RGB triples each in range [0,255]
語法
set palette file "palette.bin" binary record=64 using 1:2:3 # put 64 triplets of R,G,B doubles into file palette.bin and load
我們可以使用此命令在命令列中輸入顏色表
- 我們提供“-”[6] 而不是檔名
- 輸入表格
- 用字母 e 結束
# Equidistant rainbow (blue-green-yellow-red) palette
     set palette model RGB file "-"
     0 0 1
     0 1 0
     1 1 0
     1 0 0
     e
# cpt-city/ma/gray/grayscale01a 0 … 100, continuous, RGB, 3 segments
set palette file "-"
0.00000 0.00000 0.00000 0.00000
0.35010 0.93333 0.93333 0.93333
0.75000 0.80000 0.80000 0.80000
1.00000 0.66667 0.66667 0.66667
e
- Cubehelix 漸變
-
 2D RGB 剖面
 -
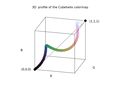 3D RGB 剖面


由 D A Green (2011)[7] 開發的顏色調色盤系列,其中顏色(色調)沿著標準色輪變化,而當灰度值從 0 變為 1 時,強度單調增加。
優勢
- 在彩色和黑白中同樣列印良好[8]
gnuplot> set palette cubehelix
gnuplot> show palette
	palette is COLOR
	Cubehelix color palette: start 0.5 cycles -1.5 saturation 1
	figure is POSITIVE
	all color formulae ARE NOT written into output postscript file
	allocating ALL remaining color positions for discrete palette terminals
	Color-Model: RGB
	gamma is 1.5
在程式碼中
  // color.h: t_sm_palette typedef struct (Declaration of smooth palette, i.e. palette for smooth colours)
  /* control parameters for the cubehelix palette scheme */
  double cubehelix_start;	/* offset (radians) from colorwheel 0 */
  double cubehelix_cycles;	/* number of times round the colorwheel */
  double cubehelix_saturation;	/* color saturation */
cubehelix 調色盤可以透過 gamma 修改。例如
set palette cubehelix gamma 2.0
使用 gnuplot 程式碼的 C 函式
/*
 GNUPLOT - stdfn.h
 Copyright 1986 - 1993, 1998, 2004   Thomas Williams, Colin Kelley
*/
#ifndef clip_to_01
#define clip_to_01(val)	\
    ((val) < 0 ? 0 : (val) > 1 ? 1 : (val))
#endif

/*
 input : position
 output : c array ( rgb color)

the colour scheme spirals (as a squashed helix) around the diagonal of the RGB colour cube

https://arxiv.org/abs/1108.5083
A colour scheme for the display of astronomical intensity images by D. A. Green
*/
void GiveCubehelixColor(double position, unsigned char c[]){


	/* GNUPLOT - color.h
	 * Petr Mikulik, December 1998 -- June 1999
	 * Copyright: open source as much as possible
	*/

	// t_sm_palette
  	/* gamma for gray scale and cubehelix palettes only */
  	double gamma = 1.5;

  	/* control parameters for the cubehelix palette scheme */
  	//set palette cubehelix start 0.5 cycles -1.5 saturation 1
	//set palette gamma 1.5
  	double cubehelix_start = 0.5;	/* offset (radians) from colorwheel 0 */
  	double cubehelix_cycles = -1.5;	/* number of times round the colorwheel */
  	double cubehelix_saturation = 1.0;	/* color saturation */
	double r,g,b;
	double gray = position;


	/*
 	 Petr Mikulik, December 1998 -- June 1999
 	* Copyright: open source as much as possible
 	*/
	// /* Map gray in [0,1] to color components according to colorMode */
	// function color_components_from_gray
	// from gnuplot/src/getcolor.c
	double phi, a;

	phi = 2. * M_PI * (cubehelix_start/3. +  gray * cubehelix_cycles);

	// gamma correction
	if (gamma != 1.0)    gray = pow(gray, 1./gamma);


	a = cubehelix_saturation * gray * (1.-gray) / 2.;

	// compute
	r = gray + a * (-0.14861 * cos(phi) + 1.78277 * sin(phi));
	g = gray + a * (-0.29227 * cos(phi) - 0.90649 * sin(phi));
	b = gray + a * ( 1.97294 * cos(phi));

	// normalize to [9,1] range
	r = clip_to_01(r);
	g = clip_to_01(g);
	b = clip_to_01(b);

	// change range to [0,255]
  	c[0] = (unsigned char) 255*r; //R
  	c[1] = (unsigned char) 255*g; // G
  	c[2] = (unsigned char) 255*b; // B

}
示例
語法
set palette gamma <gamma>
將 gamma 係數設定為 <gamma> 值
gamma 係數的標準值為 1.5
示例:[9]
set palette gamma 1.25
使用其他方法進行 gamma 校正:[10]
  set palette model RGB
  set palette functions gray**0.64, gray**0.67, gray**0.70
或
gamma = 2.2
color(gray) = gray**(1./gamma)
set palette model RGB functions color(gray), color(gray), color(gray) # A gamma-corrected black and white palette
對於灰度調色盤,而不是
set palette defined ( 0 0 0 0, 1 1 1 1 )
我們可以使用
set palette defined ( 0 0 0 0, 0.5 .73 .73 .73, 1 1 1 1 )
在程式碼中檢視
// color.h
/* gamma for gray scale and cubehelix palettes only */
  double gamma;
設定灰度調色盤
set palette gray
在標準設定下,這等效於
set palette gray positive gamma 1.5 # nieliniowa
如果我們想要獲得線性調色盤,我們將 gamma 設定為 1.0
set palette gray gamma 1.0 # liniowa plaeta
返回彩色調色盤
set palette color
另請參閱顏色模式
//color.h
/*
 *    color modes
 */
typedef enum {
    SMPAL_COLOR_MODE_NONE = '0',
    SMPAL_COLOR_MODE_GRAY = 'g',      /* grayscale only */
    SMPAL_COLOR_MODE_RGB = 'r',       /* one of several fixed transforms */
    SMPAL_COLOR_MODE_FUNCTIONS = 'f', /* user defined transforms */
    SMPAL_COLOR_MODE_GRADIENT = 'd',  /* interpolated table:
				       * explicitly defined or read from file */
    SMPAL_COLOR_MODE_CUBEHELIX = 'c'
} palette_color_mode;
語法
  set palette functions <R>,<G>,<B>
  set palette model { RGB | HSV | CMY | YIQ | XYZ }
可以組合使用:[11]
 set palette model HSV functions gray, 1, 1 # full color hsv = rainbow
 set palette model XYZ functions gray**0.35, gray**0.5, gray**0.8 # black to gold
gamma = 2.2
color(gray) = gray**(1./gamma)
set palette model RGB functions color(gray), color(gray), color(gray) # A gamma-corrected black and white palette
定義
- gray 是一個取值範圍為 0 到 1 的變數
語法
set palette rgbformulae <r>,<g>,<b>縮寫形式
set palette rgb r,g,b
r、g 和 b 是用於計算每種顏色成分的函式。(儘管顏色成分的名稱是 R、G 和 B,但它們的含義取決於 色彩空間,即在 HSV 模型中,R 將代表 H)。我們有 37 個內建函式,從 0 到 36 編號(負數會產生相反的梯度)。我們可以顯示它們
show palette rgbformulae
我們將獲得
* there are 37 available rgb color mapping formulae:
0: 0               1: 0.5             2: 1
3: x               4: x^2             5: x^3
6: x^4             7: sqrt(x)         8: sqrt(sqrt(x))
9: sin(90x)       10: cos(90x)       11: |x-0.5|
12: (2x-1)^2       13: sin(180x)      14: |cos(180x)|
15: sin(360x)      16: cos(360x)      17: |sin(360x)|
18: |cos(360x)|    19: |sin(720x)|    20: |cos(720x)|
21: 3x             22: 3x-1           23: 3x-2
24: |3x-1|         25: |3x-2|         26: (3x-1)/2
27: (3x-2)/2       28: |(3x-1)/2|     29: |(3x-2)/2|
30: x/0.32-0.78125 31: 2*x-0.84       32: 4x;1;-2x+1.84;x/0.08-11.5
33: |2*x - 0.5|    34: 2*x            35: 2*x - 0.5
36: 2*x - 1
* negative numbers mean inverted=negative colour component
* thus the ranges in `set pm3d rgbformulae' are -36..36
程式碼位於:gnuplot/src/getcolor.c/GetColorValueFromFormula


預設情況下,紅色成分選擇函式編號 7,綠色成分選擇函式編號 5,藍色成分選擇函式編號 15。我們可以選擇其他組合,例如文件中建議的“熱”組合(即黑色-紅色-黃色-白色)。
set palette rgbformulae 21,22,23
或反向熱梯度
set palette rgbformulae -21,-22,-23
或反向線性灰度梯度
set palette rgbformulae -3,-3,-3 # 1-x, 1-x, 1-x
RGB 空間示例:[12]
       7,5,15   ... traditional pm3d (black-blue-red-yellow)
       3,11,6   ... green-red-violet
       23,28,3  ... ocean (green-blue-white); try also all other permutations
       30,31,32 ... color printable on gray (black-blue-violet-yellow-white)
       33,13,10 ... rainbow (blue-green-yellow-red)
       34,35,36 ... AFM hot (black-red-yellow-white)
完整的 HSV 調色盤
3,2,2 ... red-yellow-green-cyan-blue-magenta-red
語法
set palette defined { ( <gray1> <color1> {, <grayN> <colorN>}... ) }
其中
<color> := { <r> <g> <b> | ’<color-name>’ | ’#rrggbb’ }
調色盤是透過定義中指定的數值之間的線性插值構建的。
示例
 set palette defined (0 "dark-green", 1 "green", 1 "yellow", 4 "red")
 test palette
我們得到一個不連續的梯度。
使用 2 種顏色,我們在白色(1 1 1)和黑色(0 0 0)之間獲得連續梯度(線性)。
   set palette model RGB
   set output "gray.png"
   set palette defined (0 1 1 1, 1 0 0 0) # <r> <g> <b>
   test palette
set palette 命令的另一種等效語法
   set palette defined ( 0 "white", 1 "black") # ’<color-name>’
   set palette defined ( 0 "#ffffff", 1 "#000000") # ’#rrggbb’
# Approximate the default palette used by MATLAB:
set pal defined (1 '#00008f', 8 '#0000ff', 24 '#00ffff', 40 '#ffff00', 56 '#ff0000', 64 '#800000')

我們可以從以下位置輸入資料:
- 命令列
- 從調色盤檔案 pal
load 'a.pal'
文字檔案 pal 的示例
# jet.pal with 4 columns
set palette defined (0  0.0 0.0 0.5, \
                     1  0.0 0.0 1.0, \
                     2  0.0 0.5 1.0, \
                     3  0.0 1.0 1.0, \
                     4  0.5 1.0 0.5, \
                     5  1.0 1.0 0.0, \
                     6  1.0 0.5 0.0, \
                     7  1.0 0.0 0.0, \
                     8  0.5 0.0 0.0 )
#  ColorBrewer Accent
# https://github.com/Gnuplotting/gnuplot-palettes/blob/master/accent.pal
# for use with qualitative/categorical data
# provides 8 colors, 4 pale and 4 saturated
# compatible with gnuplot >=4.2
# author: Anna Schneider
# pale green - pale purple - pale orange - pale yellow - blue - magenta - brown - grey
# palette
set palette maxcolors 8
set palette defined (
0 '#7FC97F',\
1 '#BEAED4',\
2 '#FDC086',\
3 '#FFFF99',\
4 '#386CB0',\
5 '#F0027F',\
6 '#BF5B17',\
7 '#666666' )
調色盤集合
檢查當前調色盤的梯度
show palette gradient
我們得到
 0. gray=0.0000, (r,g,b)=(1.0000,1.0000,1.0000), #ffffff = 255 255 255
 1. gray=1.0000, (r,g,b)=(0.0000,0.0000,0.0000), #000000 =   0   0   0
- ↑ 維基百科上的顏色梯度
- ↑ /src/command.c
- ↑ Charles Poynton 的 Poynton 顏色常見問題解答
- ↑ P K Janert 的 livebook gnuplot-in-action-second-edition
- ↑ 英語維基百科上的亮度 (影片)
- ↑ gnuplot 5.0.4 : 特殊檔名
- ↑ D. A. Green 關於天文強度影像顯示的配色方案
- ↑ James Davenport 的 cubehelix-or-how-i-learned-to-love
- ↑ gnuplot 5.5 演示 pm3dgamma
- ↑ gnuplot 5.0.4 : gamma
- ↑ gnuplot 4.2 文件:調色盤/函式
- ↑ gnuplot-doc : rgbformulae